|
|
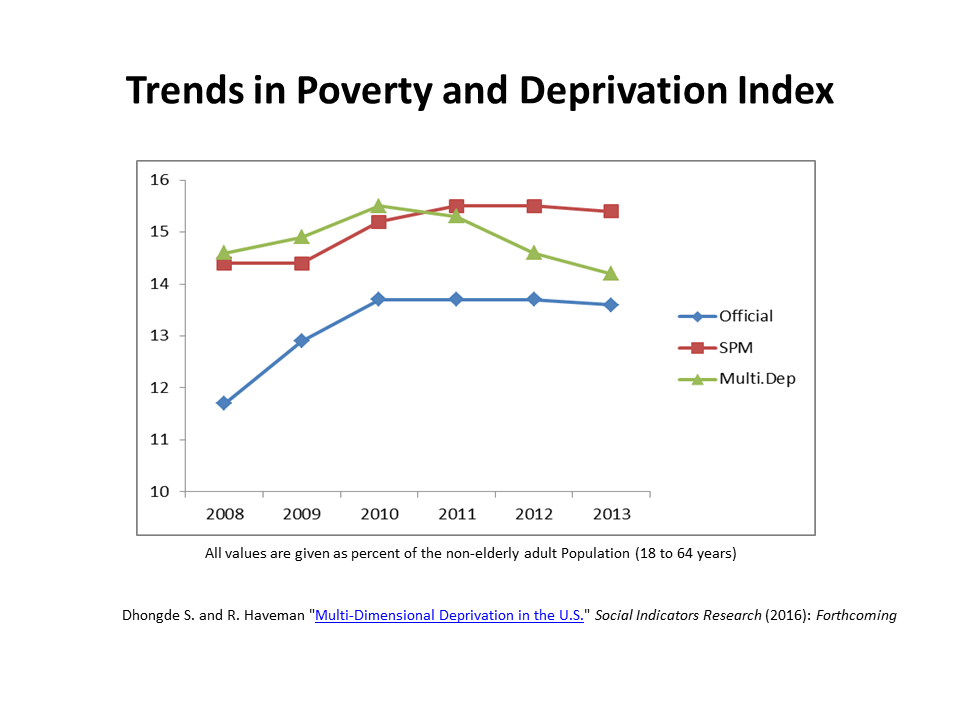
“Spatial and Temporal Trends in Multidimensional Poverty in the United States over the Last Decade” Social Indicators Research (2022) This paper undertakes a comprehensive analysis of multidimensional poverty in the United States over the last decade. It provides estimates of multidimensional poverty over more than a decade, from 2008 to 2019, which covers the Great Recession and the recovery following the recession when major policy changes such as the Affordable Care Act were implemented. For the first time, spatial trends in estimates of multidimensional poverty are also provided. We measure annual poverty levels in 4 regions, 50 states and examine the relation between multidimensional poverty and neighborhood characteristics. We find that on average, 13 percent of the United States population was multidimensional poor. Poverty rates were high in the South and the West and among young adults, immigrants and Hispanics. “Analyzing Racial and Ethnic Differences in the USA through the Lens of Multidimensional Poverty” Journal of Economics, Race and Policy (2022) This paper provides a unified framework for practitioners who wish to estimate alternative indices of multidimensional poverty. These alternative indices are used to estimate multidimensional poverty in the United States over the last decade with a focus on analyzing trends by race and ethnicity. Individual level data on five different dimensions of well-being are compiled over the last decade using annual Census surveys. We find that multidimensional poverty in the United States declined over time regardless of the index used. A higher incidence of multidimensional poverty was observed among Hispanics, American Indians and Blacks. Poverty ranking among racial/ethnic groups was robust to the indices used. Estimates of alternative indices highlight different aspects of multidimensional poverty and provide complementary information on poverty in the United States in the last decade. “Multidimensional economic deprivation during the coronavirus pandemic: Early evidence from the United States“ PLOS ONE (2020) The coronavirus pandemic led to a severe economic shock in the United States. This paper uses a unique survey data collected early on in the pandemic to measure economic deprivation among individuals. Results show that almost 25 percent of the respondents faced hardships in at least two of the four indicators. More than 13 percent of adults reported their inability to pay monthly bills and struggled to make ends meet financially. The economic shock affected Hispanics in a more profound way. More than 37 percent Hispanics reported hardship in two or more indicators. Higher proportion of young adults and those without a college degree suffered multiple hardships. The paper highlights the plight of Americans during the early months of the economic crisis set in motion amid the coronavirus pandemic and sheds light on how economic disparities deepened along racial/ethnic lines. “Multi-Dimensional Deprivation in the U.S.” Social Indicators Research (2017) This paper presents a comprehensive analysis of multidimensional deprivation in the U.S. since the Great Recession, from 2008 to 2013. We estimate a multidimensional deprivation index by compiling individual level data from the American Community Survey. Lack of education, severe housing burden and lack of health insurance were some of the dimensions in which Americans were most deprived in. Our analysis underscores the need to look beyond income based poverty statistics in order to fully realize the impact of the recession on individuals’ well-being. |
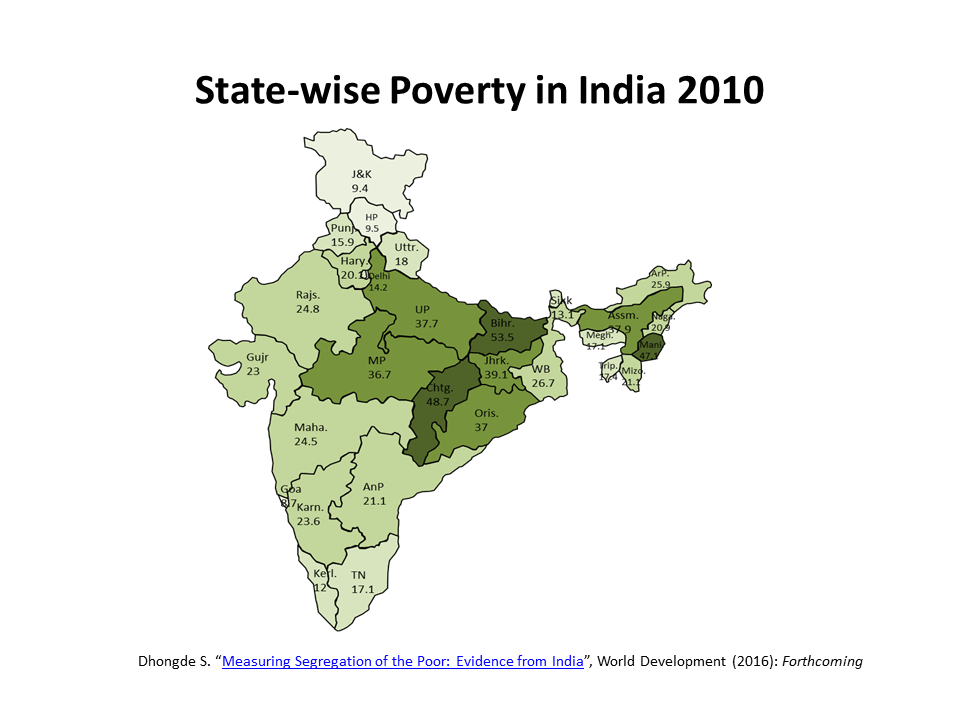 |
“Measuring Segregation of the Poor: Evidence from India”, World Development (2017) The question of how the poor are distributed regionally has received less attention. This paper fills the gap in the literature by providing a conceptual framework to measure inequality in the distribution of the poor. A poverty segregation curve is used to compare a region’s share of the poor population with its share in the overall population. A unique contribution of the paper is formulating a generalized version of the poverty segregation curve. The segregation curves are used to analyze changes in the distribution of the poor in India since the economic reforms in the early 1990s. |
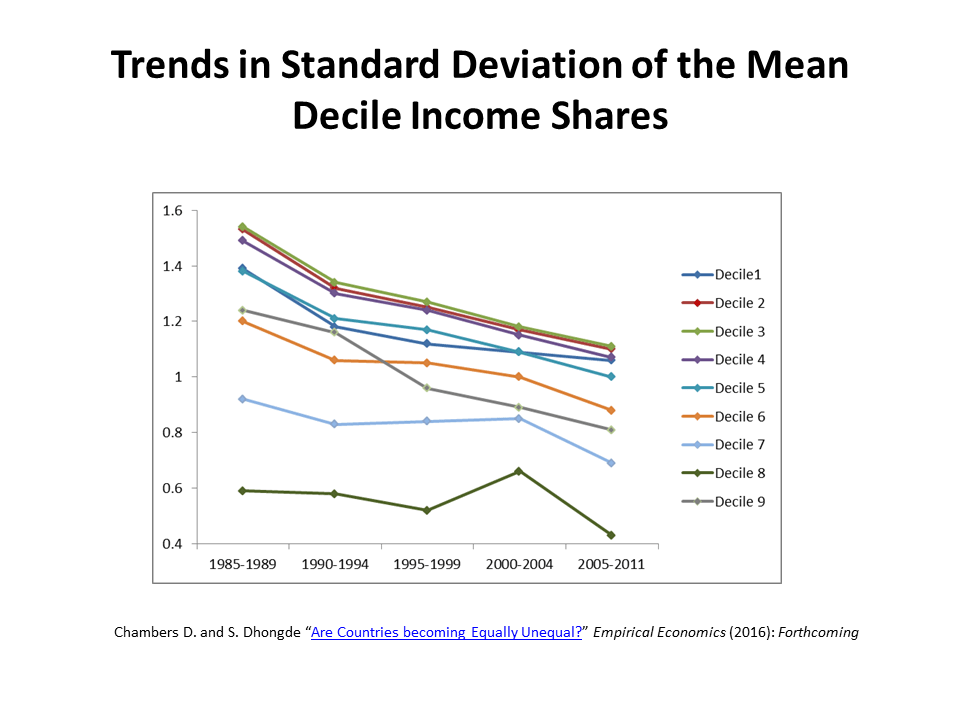 |
“Are Countries becoming Equally Unequal?” Empirical Economics (2017) In this paper we analyze changes in income distributions across developing countries by carefully compiling panel data on cross-country decile income shares over the last 25 years. We find that decile income shares exhibited a statistically significant decline in dispersion between 1985 and 2011, providing strong evidence of sigma convergence in inequality. We conclude that relative income distributions among developing countries became more unequal but noticeably more similar over time. |
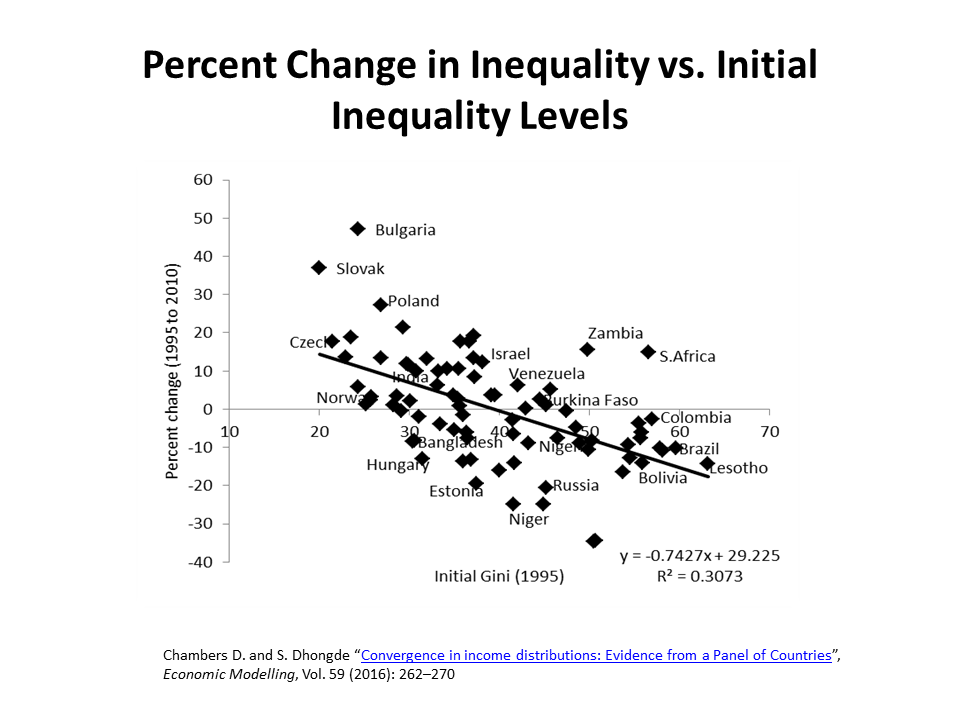 |
“Convergence in income distributions: Evidence from a Panel of Countries”, Economic Modelling (2016) Using a large panel of Gini indices covering 81 countries between 1990 and 2010, we find strong evidence that inequality declined in nations that were initially highly unequal, while inequality increased in nations with initially low inequality. This pattern holds for both developed and developing countries, but developed countries’ relative income distributions have converged at a more rapid pace. These findings are robust to the method of estimation, level of economic development, time horizon, data source or measure of inequality. |
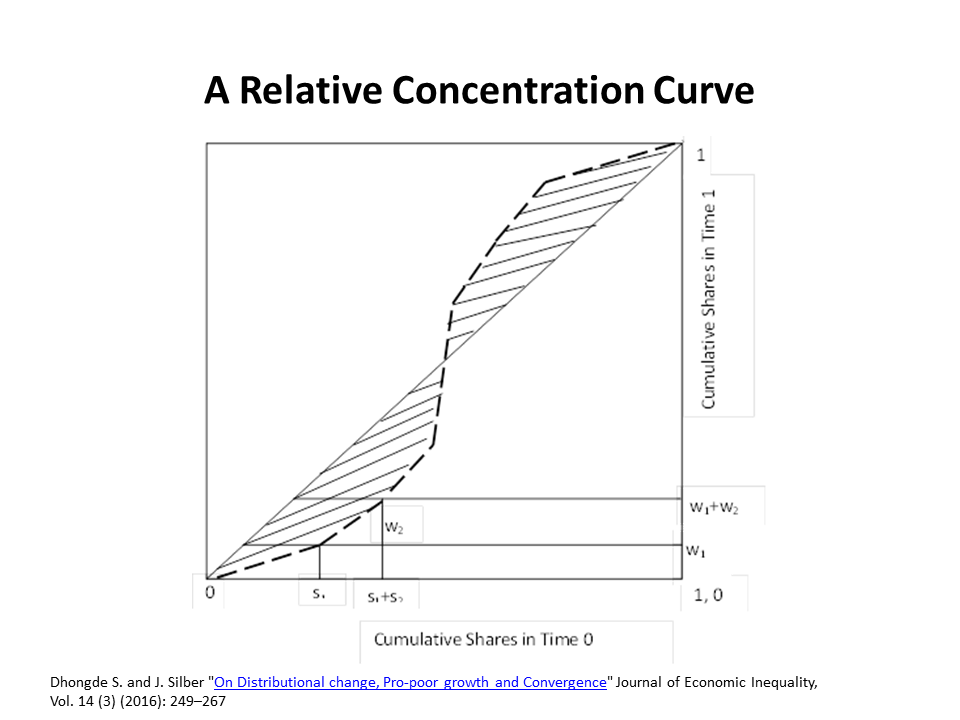 |
“On Distributional change, Pro-poor growth and Convergence” Journal of Economic Inequality, (2016) This paper proposes a unified approach to the measurement of distributional change. The framework is used to define indices of inequality in proportional growth rates, convergence, and pro-poorness of growth and associated equivalent growth rates. A distinction is made between non-anonymous and anonymous measures. The analysis is extended by using the notion of generalized Gini index. Empirical illustrations based on Indian data on individual educational achievements and on state wide infant survival levels highlight the usefulness of the proposed measures. |